
Data vizualization in Grafana Last updated: September 13, 2024 10:23
Grafana integration allows you to access Dwarfguard data from Grafana and prepare dashboards vizualizing the data in the way you want. It also comes with a data traffic dashboard showing an example.
Enabling Grafana integration
Automated Grafana integration
Grafana integration can be enabled only for one deployment on a server. If you have single Dwarfguard deployment on your server, you can easily achieve the integration. If your deployment is hosted by an operator and that operator is having multiple Dwarfguard deployments on a single VM/container, only one of such deployments can have the Grafana integration enabled.
Manual Grafana integration
Grafana, being a standalone opensource and free product, can be set up and configured completely independently on Dwarfguard. If you perform manual installation and configuration, you can provide the data from the Dwarfguard database to Grafana your own way. In this case, you do not need to go through this page but rather continue according to Grafana own documentation and start by defining SQL datasource in Grafana, having access to the SQL database. Please note that you should configure such access as strictly read-only so that you do not risk corrupting Dwarfguard data.
Performing automated Grafana integration
The integration is performed by executing following Dwarfguard cmdline on the server where the Dwarfguard is deployed. You need server admin (root) priviledges to do that.
dwarfg_grafint
The command does not require any arguments, but note that you should not try to execute it if there are multiple Dwarfguard deployments on the same machine/VM/container.
You can execute this command anytime after Dwarfguard installation.
By re-executing the command, you will effectively re-push the example dashboard into Grafana so if you somehow manage to damage the Traffic dashboard and you would like to repair it, simply execute the integration command again.
Grafana integration elements
Grafana integration performs several steps:
- Installs Grafana opensource edition.
- Configures Grafana to run behing SSL reverse proxy (Apache web server).
- Sets up Grafana admin password.
- Creates dwarfg_<domain> Grafana user.
- Allows SQL DB read-only access to selected Dwarfguard data tables to grafana DB user.
- Sets up SQL datasource for Grafana.
- Pushes Traffic dashboard into Grafana.
- Sets up redirection to that dashboard from Dwarfguard UI.
Traffic counter dashboard
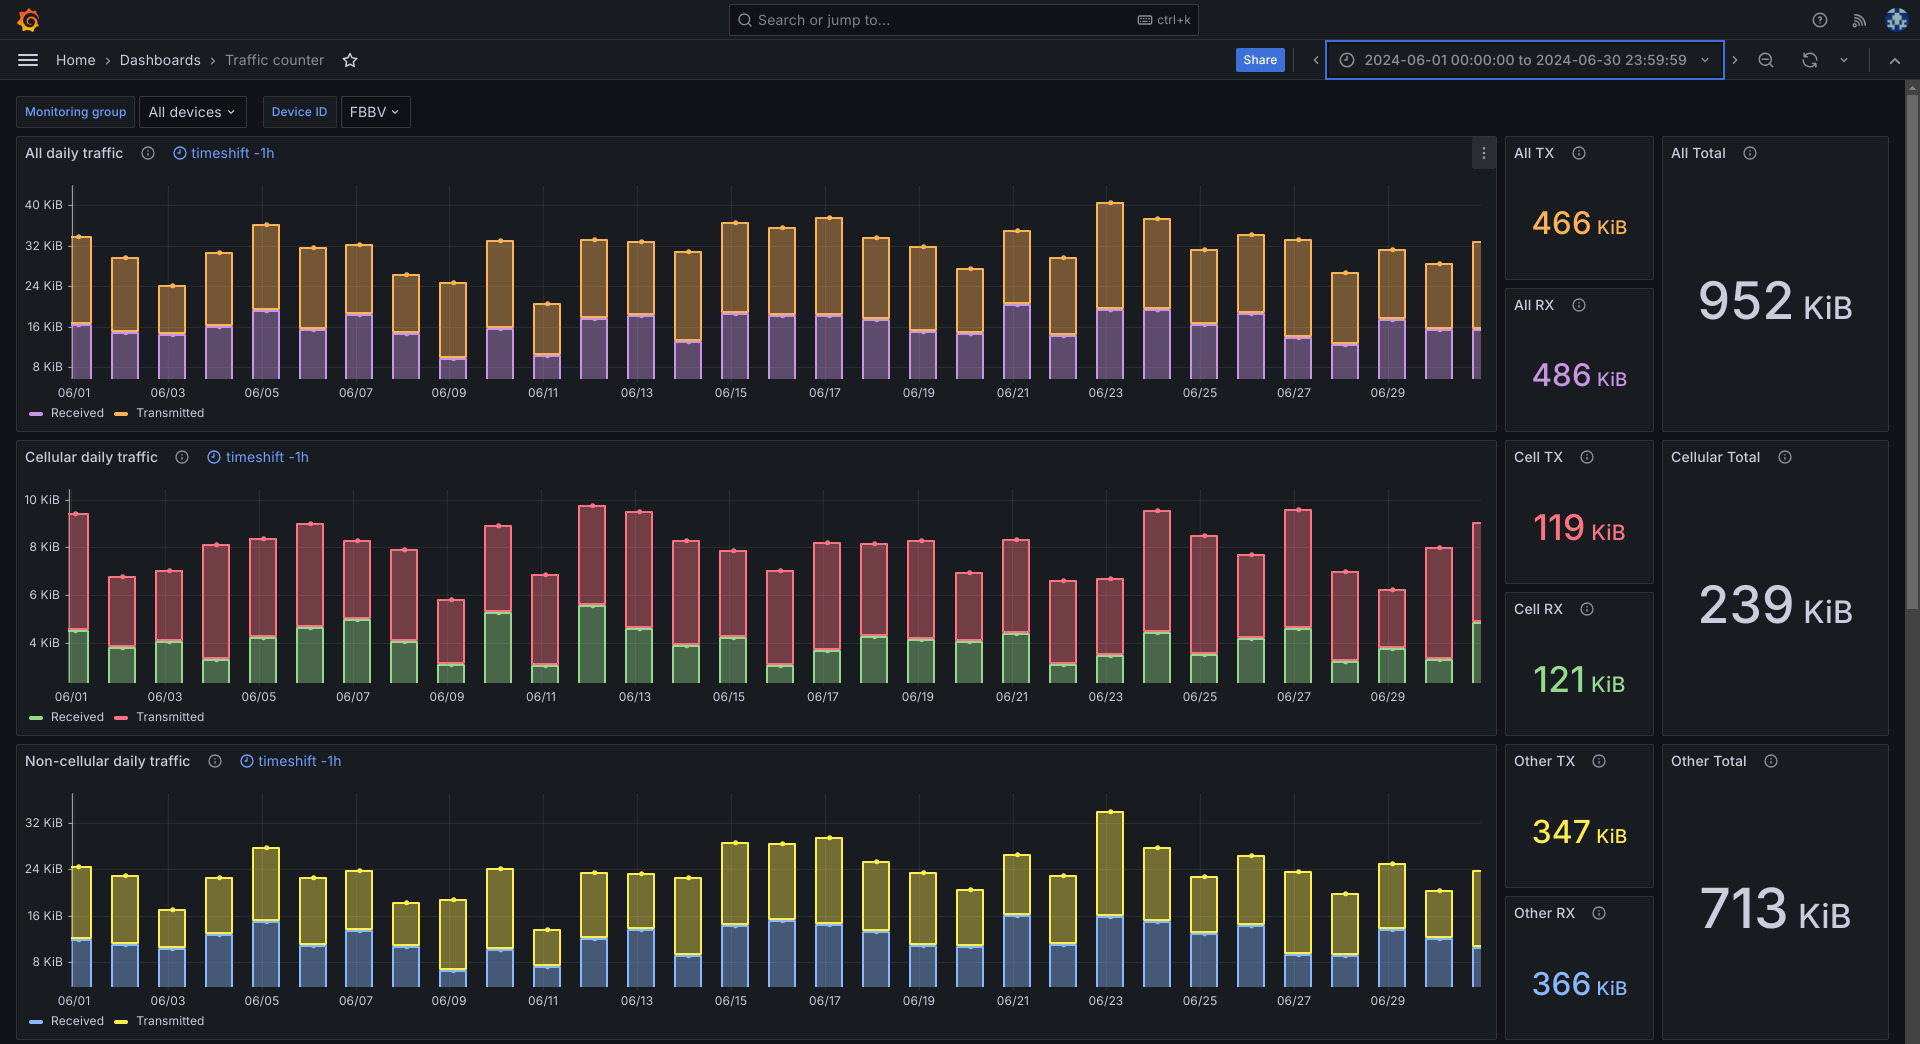
As an example of what can be vizualized in Grafana, an example dashboard showing Cellular, Non-cellular and total traffic for any Monitoring group or for individual devices is uploaded into Grafana as part of the Grafana integration.
Dashboard consists of elements via which you can select Monitoring group, individial device and timespan you want to inspect.
Once selected, the produced graphs look like:
Monitoring group "All devices" traffic:
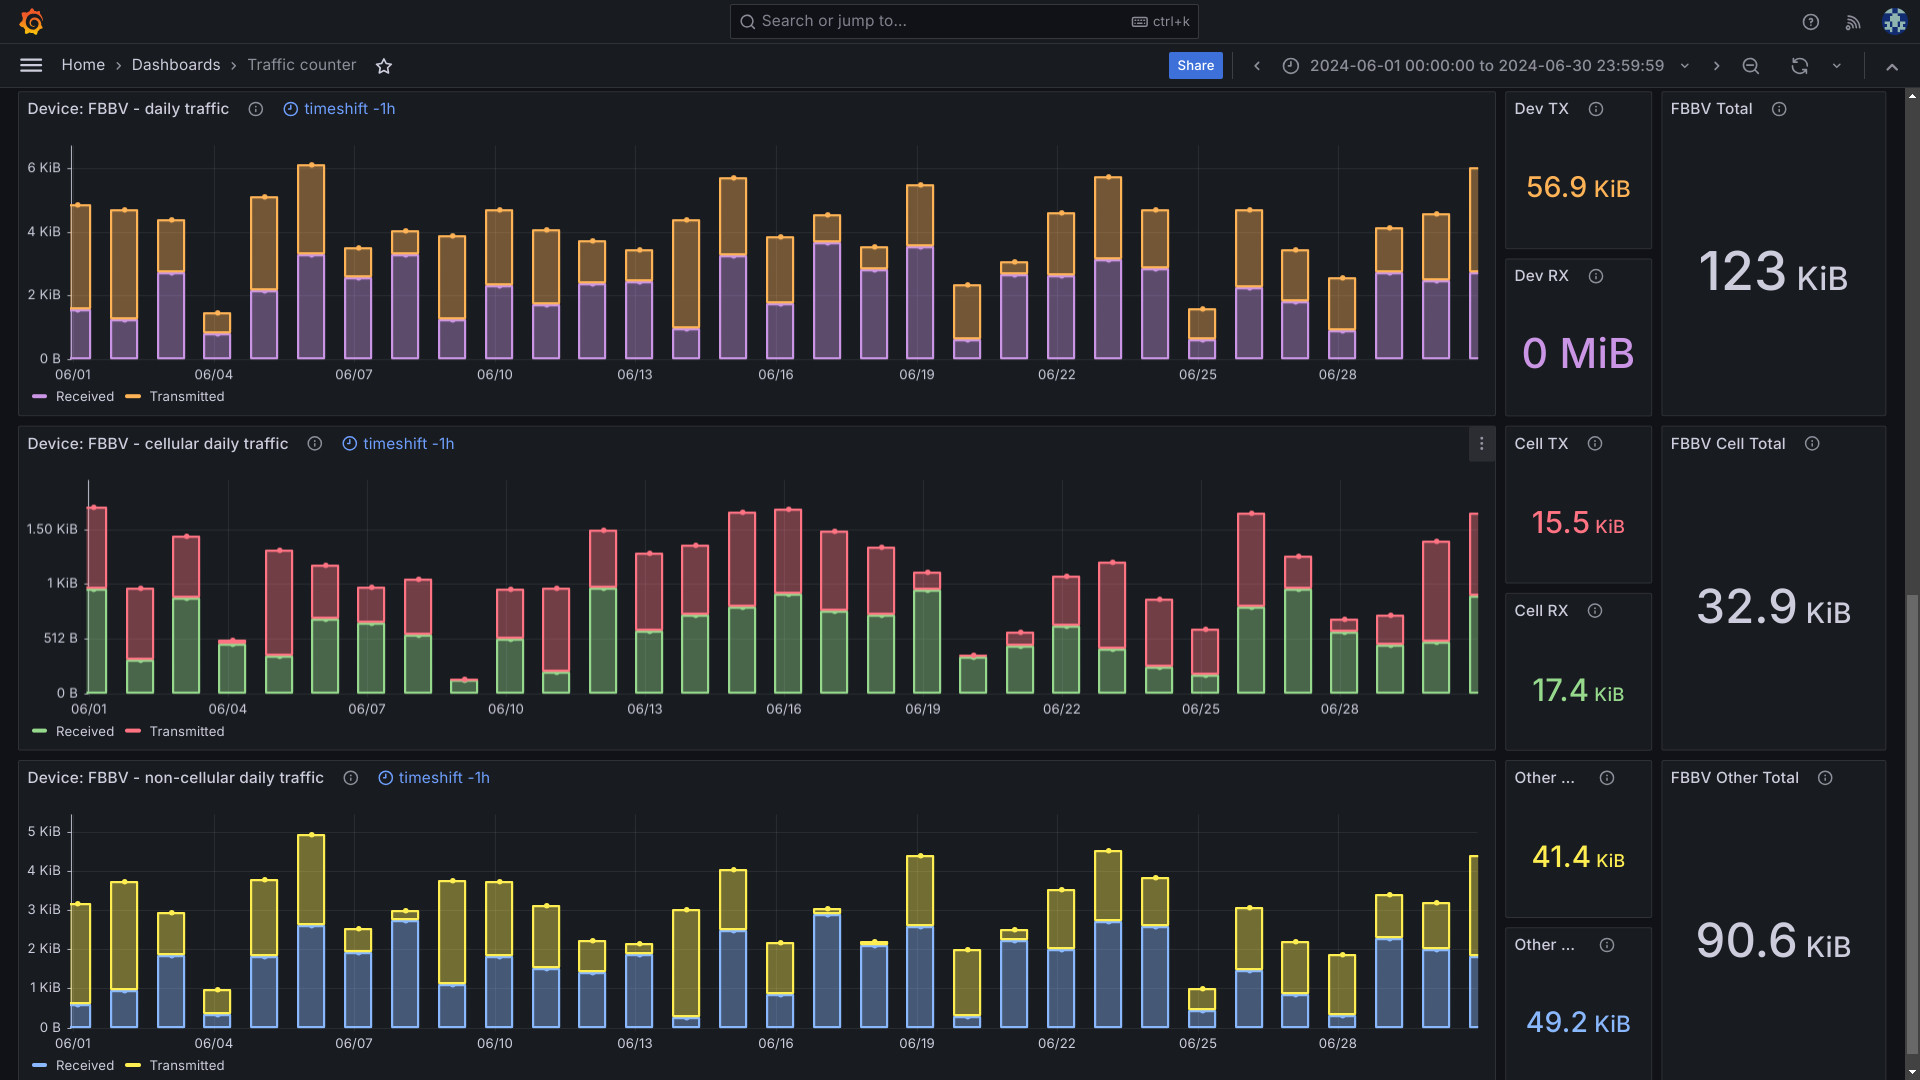
Below the monitoring group traffic, the selected single device traffic for the selected time period is shown:
If you want to create other dashboards in the Grafana, please ask your system administrator to either give you your Grafana admin password or update your Grafana user permissions to allow creation of new dashboards and access to the datasource under your Grafana user.